

Research by the Boston Consulting Group revealed that using data analytics in a strategic way can increase restaurant revenue by up to 10%, and decrease operating costs by up to 15%. That equates to a healthy improvement in your overall bottom line.
But the keyword here is ‘analytics — without a way to understand data, you just have numbers on a screen. Analysis is the secret ingredient that turns raw data into insights you can use to improve your business.
That’s where OpenTable’s Reporting can help. OpenTable translates your restaurant data into a series of actionable reports you can use to identify opportunities where you can drive efficiency and boost revenue across your business.
“Think of OpenTable as a source of valuable data,” says Oliver Gibson, Senior Restaurant Relations Manager at OpenTable. “Every action that ever happens in the system — from taking a reservation through to seating a diner and finishing a booking — is logged and can be used down the track to find areas of potential growth or opportunities to improve efficiency. OpenTable’s Reporting breaks down that data into a very easy to understand format.”
Neil Hamblen, owner of Meatmaiden steakhouse in Melbourne, says that OpenTable’s Reporting gives him data insights that help him adapt, refine and shape the success of his business.
“OpenTable is an intuitive system that actually understands hospitality and the idea that one rule can’t always apply,” he explains. “The system also understands the need to maximise bookings while still delivering an awesome guest experience — and always helps you get there.”
Here are five ways you can use OpenTable’s Reporting to add revenue to your business:
1. Maximise capacity
The shift occupancy report displays a side-by-side comparison of reservations, walk-ins and call-ins that can be filtered by date, time periods and shifts. Gibson explains that the shift occupancy report helps operators understand how busy the restaurant was throughout a shift. This enables you to identify opportunities to maximise capacity across a shift — not just at its peak.
“For example, the report might show you were full from 7:45pm to 8:30pm. But prior to 7:45pm you may have only been at 60% capacity. That means if all your staff was onboard by 5:30pm, you were essentially running at 60% throttle for the first two hours leading up to that peak 45-minute period,” he says.
“We would then review the settings and look for ways to bring more bookings in during the quieter part of that shift. And extra diners add up quickly. Let’s say your spend per head is $50, every additional diner we find for that one shift is going to be another $2,500 per year,” says Gibson.
2. Optimise turn times
The turn time analysis report enables you to compare your scheduled turn times against the actual turn times. This will reveal where you can optimise turn times to bring more diners in.
“For example, you might be giving your parties of two, a two hour duration on a Friday night. But then you look at the turn time analysis report, and you see that they’re only taking one hour and 25 minutes,” Gibson explains.
“If you’re allowing two hours, that means if diners are coming in at 8pm, the only way you’re going to get in an early sitting is if diners are happy to dine at 6pm. In this example, allowing a two hour turn time isn’t necessary, so you’re potentially missing out on the opportunity to do an early sitting.”
3. Increase cover growth
The cover trends report examines seated covers over a specified time period. It enables you to compare month-to-month or year-over-year data to benchmark cover trends and identify opportunities to drive cover growth.
Gibson uses the cover trends report to help restaurants create data-driven marketing campaigns that are designed to bring in more diners when you need them.
“The cover trends report shows reservation lead times — or how far in advance people make bookings,” he explains. “For example, the report might show that most of your bookings for a Friday come in around 72 hours in advance. So you’ll know how your Friday night is tracking 72, 48 and 24 hours in advance. This will tell you exactly when you need to create a promotion to attract a few more bookings.”
4. Data-driven business improvement
But that’s really only the tip of the iceberg when it comes to using OpenTable’s Reporting to improve your business.
First-time visits, guest frequency, reservation, referral tracking, monthly email, guest export, reviews and group reports provide a full suite of data insights that will help you identify opportunities to drive efficiency and generate extra revenue across your business.
5. Understand how your compare to local restaurants
You can even get insights into how other local restaurants are performing. Benchmark reporting enables comparison of key metrics like seated guest activity, spend, and reviews across our vast network of restaurants — including a minimum of 25 restaurants in any set neighbourhood.
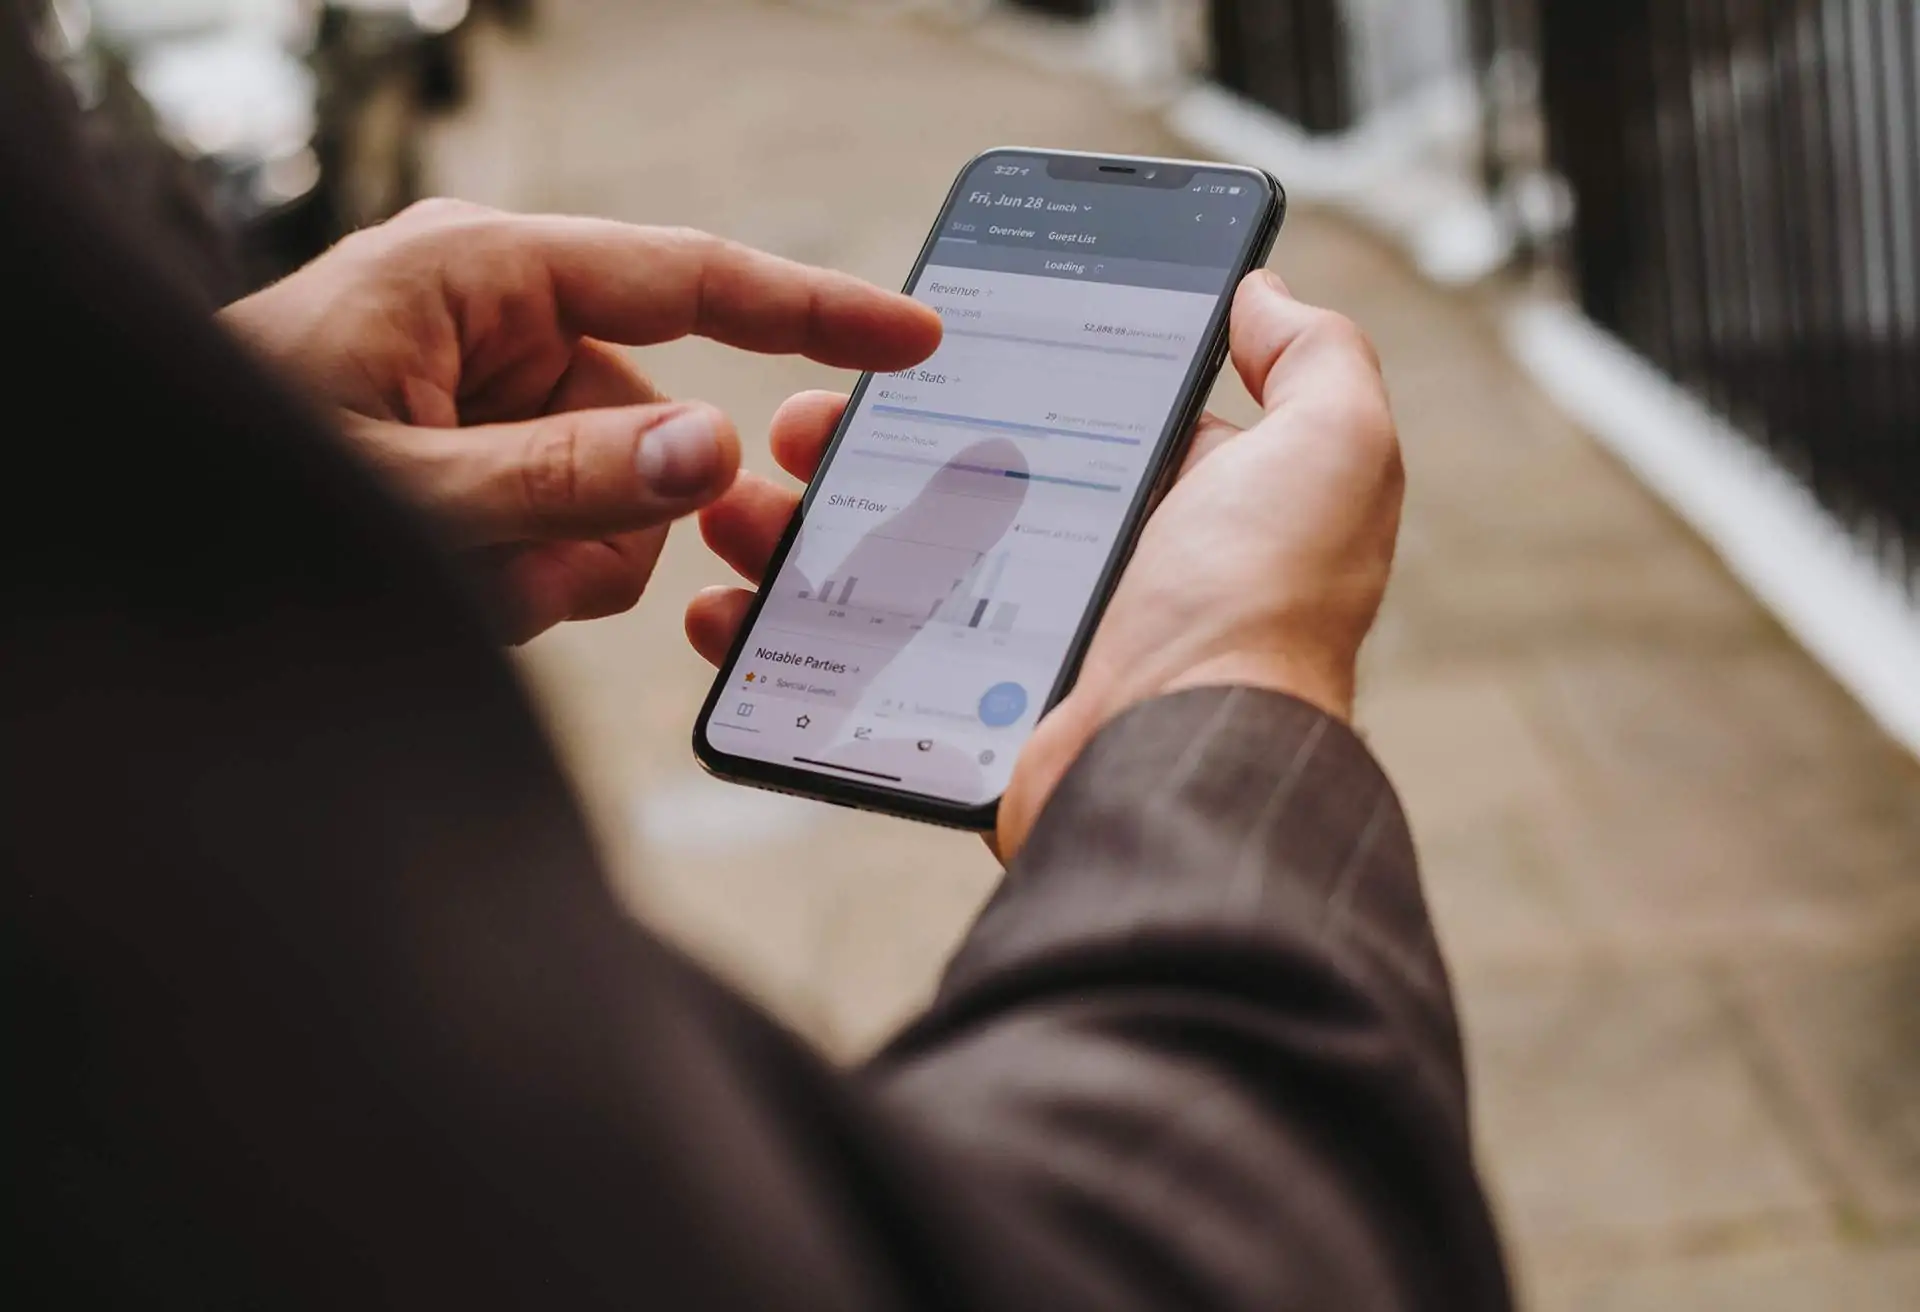
Perhaps best of all, with OpenTable’s Reporting, you have a world of data in your pocket. A range of key business metrics can be viewed via OpenTable owner app any time, from any place.
“That means you don’t need to even be in the restaurant to assess how it’s performing,” says Gibson. “It’s all about turning data into real, actionable insights you can use in the field to generate more revenue and improve your business. At the end of the day, if you’re not assessing, you’re guessing.”
Learn about how OpenTable’s reporting can help your business


